IPL team records: Results summary, highest and lowest totals, and much else
IPL team records: Results summary, highest and lowest totals, and much else
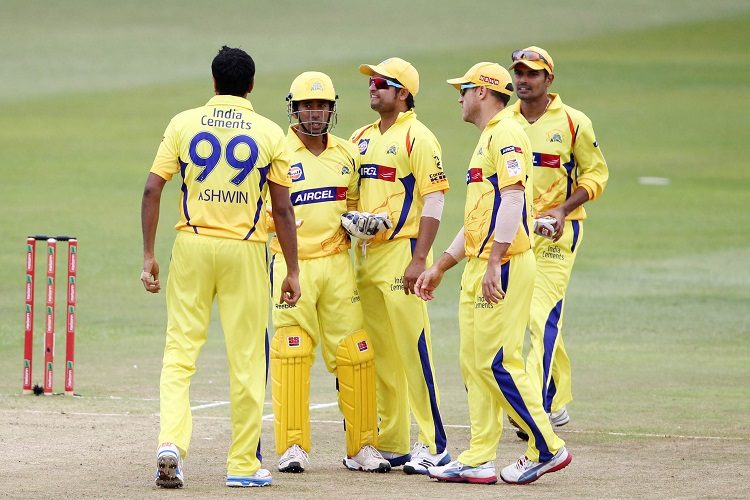
Mumbai Indians reign above Chennai Super Kings when it comes to Indian Premier League matches won – Mumbai have won 97 of their 171 matches in IPL history, and en route, have won three IPL titles. But Chennai have won 91 off 150, making for a win percentage of 61.07% over Mumbai’s 57.01%.
A lot of that is down to Chennai’s two-year ban, but such has been their dominance, they are still one of the most successful sides in the tournament, despite missing out on two years. Their win percentage is also the best in the league – there have been 13 IPL franchises in all – with none of the other sides breaching the 60-mark.
Results summary
| Team | Span | M | W | L | T+W | T+L | NR | W% | Titles |
| MI | 2008–18 | 171 | 97 | 73 | 1 | 0 | 0 | 57.01 | 3 |
| CSK | 2008–18 | 150 | 91 | 57 | 0 | 1 | 1 | 61.07 | 3 |
| KKR | 2008–18 | 162 | 85 | 75 | 0 | 2 | 0 | 53.08 | 2 |
| RCB | 2008–18 | 167 | 78 | 84 | 1 | 1 | 3 | 48.17 | 0 |
| KXIP | 2008–18 | 162 | 74 | 86 | 2 | 0 | 0 | 46.29 | 0 |
| RR | 2008–18 | 132 | 68 | 60 | 2 | 1 | 1 | 53.05 | 1 |
| DD | 2008–18 | 161 | 67 | 91 | 0 | 1 | 2 | 42.45 | 0 |
| SRH | 2013–18 | 93 | 51 | 41 | 1 | 0 | 0 | 55.37 | 1 |
| DCh | 2008–12 | 75 | 29 | 46 | 0 | 0 | 0 | 38.66 | 1 |
| RPS | 2016–17 | 30 | 15 | 15 | 0 | 0 | 0 | 50 | 0 |
| GL | 2016–17 | 30 | 13 | 16 | 0 | 1 | 0 | 45 | 0 |
| PWI | 2011–13 | 46 | 12 | 33 | 0 | 0 | 1 | 26.66 | 0 |
| KTK | 2011 | 14 | 6 | 8 | 0 | 0 | 0 | 42.85 | 0 |
The inaugural edition, in 2008, was won by Rajasthan Royals – they beat Chennai by three wickets in the final. Since then, Chennai have gone on to reach the play-offs in every edition of the tournament, winning the trophy thrice, and making the finals seven times in nine season. No other side have come close in terms of dominance.
Year-wise results
| Season | Winner | Margin | Runner-up | Final venue |
| 2008 | Royals | 3 wickets | Super Kings | Mumbai |
| 2009 | Chargers | 6 runs | Royal Challengers | Johannesburg |
| 2010 | Super Kings | 22 runs | Indians | Mumbai |
| 2011 | Super Kings | 58 runs | Royal Challengers | Chennai |
| 2012 | Knight Riders | 5 wickets | Super Kings | Chennai |
| 2013 | Indians | 23 runs | Super Kings | Kolkata |
| 2014 | Knight Riders | 3 wickets | Kings XI | Bengaluru |
| 2015 | Indians | 41 runs | Super Kings | Kolkata |
| 2016 | Sunrisers | 8 runs | Royal Challengers | Bengaluru |
| 2017 | Indians | 1 run | Supergiant | Hyderabad |
| 2018 | Super Kings | 8 wickets | Sunrisers | Mumbai |
The highest team score in IPL history came in 2013, when Chris Gayle, in his pomp hammered an unforgettable 66-ball 175 not out. It helped Bangalore post 263/5 against Pune Warriors India, and they won the match by a mammoth 130 runs.
Bangalore were once again at it in 2016, when Virat Kohli and AB de Villiers scored centuries against Gujarat Lions to post 248/3 – they won by an even bigger margin of 144.
Highest totals
| Team | Score | Overs | RR | Opposition | Ground | Date |
| RCB | 263/5 | 20 | 13.15 | PWI | Bengaluru | 23-Apr-13 |
| RCB | 248/3 | 20 | 12.4 | GL | Bengaluru | 14-May-16 |
| CSK | 246/5 | 20 | 12.3 | RR | Chennai | 03-Apr-10 |
| KKR | 245/6 | 20 | 12.25 | KXIP | Indore | 12-May-18 |
| CSK | 240/5 | 20 | 12 | KXIP | Mohali | 19-Apr-08 |
| RCB | 235/1 | 20 | 11.75 | MI | Mumbai | 10-May-15 |
| KXIP | 232/2 | 20 | 11.6 | RCV | Dharamsala | 17-May-11 |
| DD | 231/4 | 20 | 11.55 | KXIP | Delhi | 23-Apr-11 |
| KXIP | 231/4 | 20 | 11.55 | CSK | Cuttack | 07-May-14 |
| KXIP | 230/3 | 20 | 11.5 | MI | Mumbai | 11-May-17 |
Lowest totals
Interestingly, the lowest total of the tournament was also registered by Bangalore, in 2017. They were bundled out for 49 by Kolkata Knight Riders, with Bangalore’s chase of Kolkata’s 132 lasting just 9.4 overs. Not one player made a double-digit score in the innings.
| Team | Score | Overs | RR | Inns | Against | Ground | Date |
| RCB | 49 | 9.4 | 5.06 | 2 | KKR | Kolkata | 23-Apr-17 |
| RR | 58 | 15.1 | 3.82 | 2 | RCB | Cape Town | 18-Apr-09 |
| DD | 66 | 13.4 | 4.82 | 2 | MI | Delhi | 06-May-17 |
| DD | 67 | 17.1 | 3.9 | 1 | KXIP | Mohali | 30-Apr-17 |
| KKR | 67 | 15.2 | 4.36 | 1 | MI | Mumbai | 16-May-08 |
| RCB | 70 | 15 | 4.66 | 1 | RR | Abu Dhabi | 26-Apr-14 |
| KXIP | 73 | 15.5 | 4.61 | 1 | RPS | Pune | 14-May-17 |
| KTK | 74 | 16.3 | 4.48 | 2 | DC | Kochi | 27-Apr-11 |
| CSK | 79 | 15.2 | 5.15 | 2 | MI | Mumbai | 05-May-13 |
Related News


Trending News