ICC World Cup 2019 batsmen: Pre-tournament runs, fours, sixes, strike rates, other batting records
ICC World Cup 2019 batsmen: Pre-tournament runs, fours, sixes, strike rates, other batting records
With a week to go before the World Cup, let us have a look at some of the relevant batting statistics of the players. These numbers reflect the chart leaders only from the ten participating countries against only the ten participating counties from January 1, 2018.
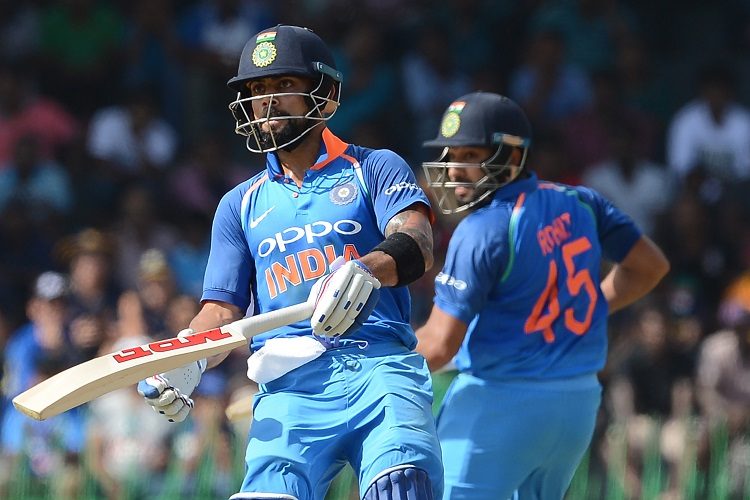
Virat Kohli‘s numbers look staggering over this period. Not only does he have most runs, his average and strike rate make fantastic reading. Rohit Sharma, too, has been excellent.
| Player | Team | R | Ave | SR | 4s | 6s |
| Virat Kohli | India | 1,813 | 90.65 | 100 | 180 | 18 |
| Rohit Sharma | India | 1,563 | 60.11 | 92 | 144 | 55 |
| Joe Root | England | 1,264 | 54.95 | 87 | 96 | 6 |
| Jason Roy | England | 1,262 | 48.53 | 110 | 135 | 35 |
| Jonny Bairstow | England | 1,232 | 44.00 | 117 | 151 | 34 |
| Ross Taylor | New Zealand | 1,232 | 82.13 | 92 | 99 | 17 |
| Shikhar Dhawan | India | 1,190 | 41.03 | 97 | 164 | 13 |
| Eoin Morgan | England | 1,156 | 52.54 | 100 | 100 | 39 |
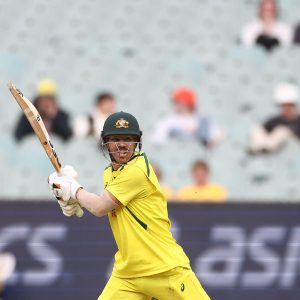
| Aaron Finch | Australia | 1,127 | 49.00 | 85 | 89 | 31 |
| Shai Hope | West Indies | 1,093 | 64.29 | 81 | 82 | 20 |
The batting averages chart has a surprise entry – of Rassie van der Dussen – at second spot, just after Kohli. Hashmatullah Shahidi features at five.
| Player | Team | R | Ave | SR | 4s | 6s |
| Virat Kohli | India | 1,813 | 90.65 | 100 | 180 | 18 |
| Rassie van der Dussen | South Africa | 353 | 88.25 | 76 | 23 | 6 |
| Ross Taylor | New Zealand | 1,232 | 82.13 | 92 | 99 | 17 |
| Faf du Plessis | South Africa | 835 | 69.58 | 92 | 90 | 10 |
| Hashmatullah Shahidi | Afghanistan | 263 | 65.75 | 72 | 17 | 0 |
| Shai Hope | West Indies | 1,093 | 64.29 | 81 | 82 | 20 |
| Chris Gayle | West Indies | 577 | 64.11 | 114 | 31 | 47 |
| Rohit Sharma | India | 1,563 | 60.11 | 92 | 144 | 55 |
| Usman Khawaja | Australia | 769 | 59.15 | 84 | 77 | 4 |
| Jos Buttler | England | 1,026 | 57.00 | 124 | 87 | 43 |
Despite their excellent averages, no Indian features in the list of top ten strike rates. On the other hand, Jos Buttler and Jonny Bairstow are both in the top three.
| Player | Team | R | Ave | SR | 4s | 6s |
| Jos Buttler | England | 1,026 | 57.00 | 124 | 87 | 43 |
| Imad Wasim | Pakistan | 348 | 49.71 | 121 | 35 | 9 |
| Jonny Bairstow | England | 1,232 | 44.00 | 117 | 151 | 34 |
| Thisara Perera | Sri Lanka | 592 | 31.15 | 117 | 41 | 26 |
| Glenn Maxwell | Australia | 665 | 36.94 | 116 | 66 | 18 |
| Chris Gayle | West Indies | 577 | 64.11 | 114 | 31 | 47 |
| Shimron Hetmyer | West Indies | 680 | 45.33 | 112 | 40 | 30 |
| Colin Munro | New Zealand | 453 | 21.57 | 111 | 59 | 12 |
| Jason Roy | England | 1,262 | 48.53 | 110 | 135 | 35 |
| JP Duminy | South Africa | 357 | 39.66 | 108 | 30 | 10 |
Kohli’s 9 hundreds (and 2.78 innings per hundred) are significantly better than anyone else’s tally.
| Player | Team | Inn | 100 | I/100 |
| Virat Kohli | India | 25 | 9 | 2.78 |
| Rohit Sharma | India | 31 | 6 | 5.17 |
| Aaron Finch | Australia | 24 | 5 | 4.80 |
| Jason Roy | England | 26 | 5 | 5.20 |
Kohli’s 13 fifties have come at a rate better than one every two innings – but Ross Taylor actually has a better rate than even him.
| Player | Team | Inn | 100 | 50 | 50+ | I/50+ |
| Virat Kohli | India | 25 | 9 | 4 | 13 | 1.92 |
| Rohit Sharma | India | 31 | 6 | 7 | 13 | 2.38 |
| Eoin Morgan | England | 28 | 1 | 11 | 12 | 2.33 |
| Ross Taylor | New Zealand | 21 | 3 | 8 | 11 | 1.91 |
| Joe Root | England | 31 | 4 | 6 | 10 | 3.10 |
Rohit’s 55 sixes have been the most over this period, but Chris Gayle‘s rate of a six every 11 balls puts him miles ahead of anyone else.
| Player | Teams | B | 6s | B/6 |
| Rohit Sharma | India | 1,708 | 55 | 31.1 |
| Chris Gayle | West Indies | 507 | 47 | 10.8 |
| Jos Buttler | England | 829 | 43 | 19.3 |
| Eoin Morgan | England | 1,159 | 39 | 29.7 |
| Jason Roy | England | 1,150 | 35 | 32.9 |
| Jonny Bairstow | England | 1,055 | 34 | 31.0 |
| Aaron Finch | Australia | 1,330 | 31 | 42.9 |
| Shimron Hetmyer | West Indies | 606 | 30 | 20.2 |
| Thisara Perera | Sri Lanka | 508 | 26 | 19.5 |
| Martin Guptill | New Zealand | 1025 | 26 | 39.4 |
Kohli has obviously hit most fours as well, but several have pipped him when it comes to balls faced per four. His consistency has been significantly dependent on singles.
| Player | Team | B | 4s | B/4 |
| Virat Kohli | India | 1,820 | 180 | 10.1 |
| Shikhar Dhawan | India | 1,232 | 164 | 7.5 |
| Jonny Bairstow | England | 1,055 | 151 | 7.0 |
| Rohit Sharma | India | 1,708 | 144 | 11.9 |
| Jason Roy | England | 1,150 | 135 | 8.5 |
| Quinton de Kock | South Africa | 781 | 107 | 7.3 |
| Eoin Morgan | England | 1,159 | 100 | 11.6 |
| Ross Taylor | New Zealand | 1,344 | 99 | 13.6 |
| Joe Root | England | 1455 | 96 | 15.2 |
| Faf du Plessis | South Africa | 911 | 90 | 10.1 |
Related News


Trending News