Vitality Blast 2019 statistical round-up after league stage: Babar, Banton, Parkinson, Rampaul top charts
Vitality Blast 2019 statistical round-up after league stage: Babar, Banton, Parkinson, Rampaul top charts
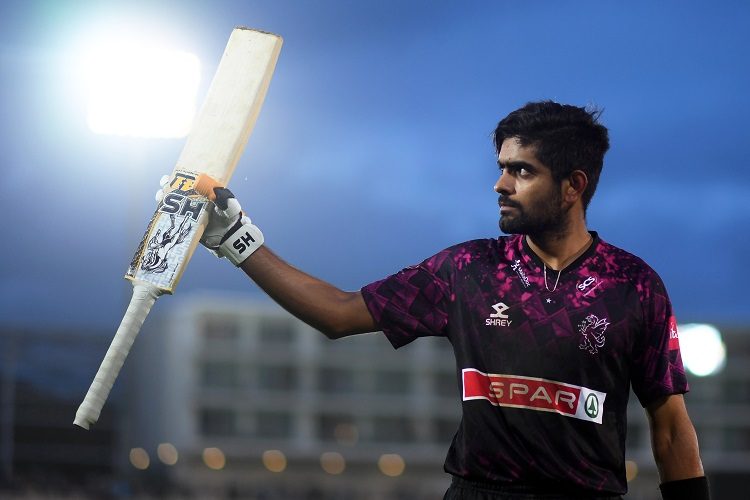
Babar Azam’s outstanding stint for Somerset culminated in him finishing at the top of the runs chart after the league phase of the 2019 Vitality Blast. At second spot is his Somerset teammate Tom Banton. They are the only ones to have topped the 500-run mark in the tournament so far.
| Players | Teams | R | Ave | SR |
| Babar Azam | Somerset | 578 | 52.54 | 149.4 |
| Tom Banton | Somerset | 549 | 42.43 | 161.5 |
| Dawid Malan | Middlesex | 488 | 44.36 | 151.1 |
| D’Arcy Short | Durham | 483 | 43.90 | 139.6 |
| Sam Hain | Birmingham | 459 | 41.72 | 118.6 |
AB de Villiers’ 84.25 runs – achieved over an aggregate of 337 runs – is the highest average of the tournament so far.
| Players | Teams | R | Ave | SR |
| AB de Villiers | Middlesex | 337 | 84.25 | 185.2 |
| Moeen Ali | Worcestershire | 191 | 63.67 | 161.9 |
| Tom Kohler-Cadmore | Yorkshire | 438 | 62.14 | 141.2 |
| Babar Azam | Somerset | 578 | 52.54 | 149.4 |
| Wayne Madsen | Derbyshire | 400 | 50.00 | 149.8 |
Not only does de Villiers average 84.25, he has also struck at 185, next to only Eddie Byrom’s strike rate of 197.
| Players | Teams | R | Ave | SR |
| Eddie Byrom | Yorkshire | 185 | 23.12 | 196.8 |
| AB de Villiers | Middlesex | 337 | 84.25 | 185.2 |
| Nicholas Pooran | Yorkshire | 122 | 40.67 | 184.8 |
| Tom Abell | Somerset | 354 | 44.25 | 177.9 |
| Cameron Delport | Essex | 309 | 28.09 | 175.6 |
Cameron Delport has hit the most sixes so far, one more than Aaron Finch and Banton.
| Players | Teams | 6s | BF | B/6 |
| Cameron Delport | Essex | 24 | 176 | 7.3 |
| Aaron Finch | Surrey | 23 | 238 | 10.3 |
| Tom Banton | Somerset | 23 | 340 | 14.8 |
| AB de Villiers | Middlesex | 20 | 182 | 9.1 |
| Dan Lawrence | Essex | 20 | 213 | 10.7 |
Delport’s 129 is the highest score of the tournament as well. He and Dawid Malan are the only ones to have got more than 102 in an innings.
| Players | Scores | Teams | Against | Date |
| Cameron Delport | 129 | Essex | Surrey | Jul 19 |
| Dawid Malan | 117 | Middlesex | Surrey | Jul 23 |
| Babar Azam | 102* | Somerset | Hampshire | Aug 9 |
| Aaron Finch | 102* | Surrey | Somerset | Aug 27 |
| Michael Klinger | 102* | Gloucestershire | Kent | Aug 29 |
Matt Parkinson and Ravi Rampaul top the wickets chart in the tournament so far. They are one ahead of Kyle Abbott.
| Players | Teams | W | Ave | Econ |
| Matt Parkinson | Lancashire | 21 | 13.38 | 7.46 |
| Ravi Rampaul | Derbyshire | 21 | 14.71 | 6.71 |
| Kyle Abbott | Hampshire | 20 | 17.80 | 8.18 |
| Toby Roland-Jones | Middlesex | 19 | 18.57 | 8.57 |
| Imran Tahir | Surrey | 19 | 20.26 | 8.19 |
| Steven Finn | Middlesex | 19 | 22.36 | 9.23 |
Colin Ackermann’s 7/18 has put him at second place in bowling averages, just behind Adam Lyth.
| Players | Teams | W | Ave | Econ |
| Adam Lyth | Yorkshire | 12 | 12.25 | 8.16 |
| Colin Ackermann | Leicestershire | 12 | 12.41 | 6.04 |
| Liam Livingstone | Lancashire | 13 | 12.92 | 7.00 |
| Rob Keogh | Northamptonshire | 10 | 13.00 | 6.50 |
| Luke Wood | Nottinghamshire | 10 | 13.30 | 6.82 |
Daryl Mitchell and Josh Cobb are the only ones to have conceded fewer runs than balls bowled. Ackermann’s excellent economy rate of 6.04 is third on the list.
| Players | Teams | W | Ave | Econ |
| Daryl Mitchell | Worcestershire | 4 | 42.50 | 5.67 |
| Josh Cobb | Northamptonshire | 2 | 63.50 | 5.77 |
| Colin Ackermann | Leicestershire | 12 | 12.41 | 6.04 |
| Scott Steel | Durham | 5 | 19.80 | 6.18 |
| Keshav Maharaj | Yorkshire | 2 | 63.00 | 6.30 |
Ackermann’s 7/18, of course, are the best bowling figures in T20 history, let alone in the tournament.
| Players | Spells | Teams | Against | Date |
| Colin Ackermann | 7/18 | Leicestershire | Birmingham | Aug 7 |
| Jack Shutt | 5/11 | Yorkshire | Durham | Aug 23 |
| Steven Finn | 5/16 | Middlesex | Surrey | Aug 8 |
| Benny Howell | 5/18 | Gloucestershire | Glamorgan | Jul 19 |
| Imran Qayyum | 5/21 | Kent | Somerset | Jul 20 |
| Toby Roland-Jones | 5/21 | Middlesex | Glamorgan | Jul 26 |
The three hat-tricks of the tournament were achieved across two consecutive nights.
| Players | Batsmen | Teams | Against | Date |
| Tom Curran | David Lloyd Colin Ingram Billy Root | Surrey | Glamorgan | Jul 25 |
| Matty Potts | Dieter Klein C Parkinson Chris Wright | Durham | Leicestershire | Jul 26 |
| Toby Roland-Jones | M de Lange D Douthwaite Andrew Salter | Middlesex | Glamorgan | Jul 26 |
Related News


Trending News