ICC World Cup 2019 statistical round-up – June 13: Buttler, Ferguson top strike rate, economy charts
ICC World Cup 2019 statistical round-up – June 13: Buttler, Ferguson top strike rate, economy charts
Two weeks have passed, South Africa have taken a downward spiral, fast bowling is back, and rain has dominated more or less everything: in a nutshell, that has been the story of the 2019 World Cup. Let us now see where the players stand after a fortnight of cricket.
It is still probably too early for batting averages, but as things stand now, Rohit and Williamson top the chart. However, one dismissal will cut their averages by half.
| Players | Teams | R | Ave | SR |
| Rohit Sharma | India | 179 | 179.00 | 83.6 |
| Kane Williamson | New Zealand | 119 | 119.00 | 69.6 |
| Shakib Al Hasan | Bangladesh | 260 | 86.67 | 95.9 |
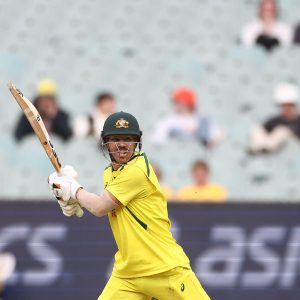
| David Warner | Australia | 255 | 85.00 | 80.4 |
| Jason Roy | England | 215 | 71.67 | 118.8 |
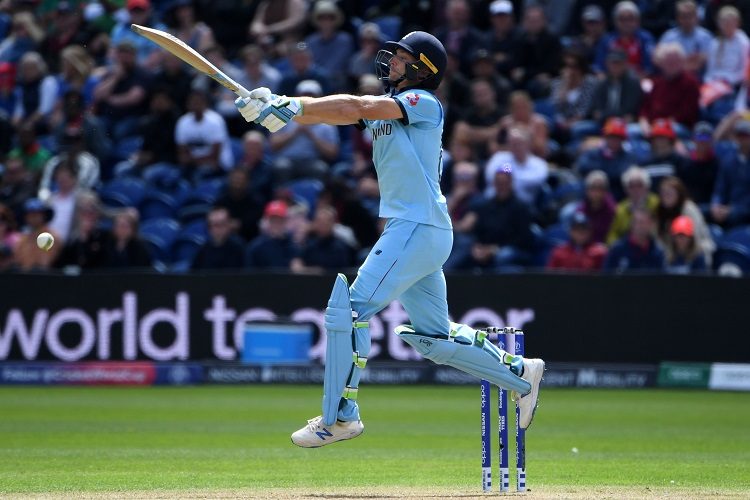
To nobody’s surprise, Buttler has moved to the top of the strike rates chart, followed by Roy. Carey makes an appearance at fourth spot.
| Players | Teams | R | Ave | SR |
| Jos Buttler | England | 185 | 61.67 | 136.0 |
| Jason Roy | England | 215 | 71.67 | 118.8 |
| Mohammad Hafeez | Pakistan | 146 | 48.67 | 108.1 |
| Alex Carey | Australia | 120 | 60.00 | 108.1 |
| Aaron Finch | Australia | 190 | 47.50 | 106.7 |
Finch’s 9 sixes are the most in the tournament by some distance. Wahab’s is an interesting entry.
| Players | Teams | 6s | BF | B/6 |
| Aaron Finch | Australia | 9 | 178 | 19.8 |
| Jos Buttler | England | 6 | 136 | 22.7 |
| Wahab Riaz | Pakistan | 5 | 52 | 10.4 |
| Eoin Morgan | England | 5 | 111 | 22.2 |
| Jason Roy | England | 5 | 181 | 36.2 |
Despite not featuring in the sixes list, both Indian openers have showed up in the fours chart, which demonstrates their approach to batting.
| Players | Teams | 4s | BF | B/4 |
| Shakib Al Hasan | Bangladesh | 27 | 271 | 10.0 |
| Jason Roy | England | 24 | 181 | 7.5 |
| David Warner | Australia | 24 | 317 | 13.2 |
| Shikhar Dhawan | India | 17 | 121 | 7.1 |
| Joe Root | England | 16 | 192 | 12.0 |
| Rohit Sharma | India | 16 | 214 | 13.4 |
Roy’s 153 is the highest score at this point by some distance. Shakib scored a hundred in the same match, Dhawan the day after, and Warner yesterday.
| Players | Scores | Teams | vs | Venue | Date |
| Jason Roy | 153 | Eng | Ban | Cardiff | Jun 8 |
| Rohit Sharma | 122* | Ind | SA | Rose Bowl | Jun 5 |
| Shakib Al Hasan | 121 | Ban | Eng | Cardiff | Jun 8 |
| Shikhar Dhawan | 117 | Ind | Aus | The Oval | Jun 9 |
| Joe Root | 107 | Eng | Pak | Trent Bridge | Jun 3 |
| David Warner | 107 | Aus | Pak | Taunton | Jun 12 |
| Jos Buttler | 103 | Eng | Pak | Trent Bridge | Jun 3 |
Four more bowlers have joined Morris at the top in the list of most maiden overs.
| Players | Teams | M | O | O/M |
| Chris Morris | South Africa | 3 | 20 | 6.67 |
| Lockie Ferguson | New Zealand | 3 | 25.3 | 8.50 |
| Jofra Archer | England | 3 | 25.5 | 8.61 |
| Mitchell Starc | Australia | 3 | 36 | 12.00 |
| Pat Cummins | Australia | 3 | 38.2 | 12.78 |
Amir’s 5/30 put against Pakistan helped him leapfrog ahead of Ferguson and Neesham in terms of bowling averages.
| Players | Teams | W | Ave | Econ |
| Mohammad Amir | Pakistan | 10 | 12.30 | 4.73 |
| Lockie Ferguson | New Zealand | 8 | 12.37 | 3.88 |
| Jimmy Neesham | New Zealand | 6 | 12.67 | 5.06 |
| Oshane Thomas | West Indies | 6 | 15.17 | 5.62 |
| Ben Stokes | England | 5 | 15.60 | 4.92 |
With a 20-over cut-off, Ferguson is the only one to have maintained an economy rate under 4.
| Players | Teams | W | Ave | Econ |
| Lockie Ferguson | New Zealand | 8 | 12.37 | 3.88 |
| Trent Boult | New Zealand | 3 | 40.67 | 4.20 |
| Pat Cummins | Australia | 9 | 18.77 | 4.40 |
| Bhuvneshwar Kumar | India | 5 | 18.80 | 4.70 |
| Mohammad Amir | Pakistan | 10 | 12.30 | 4.73 |
This week has witnessed the first 3 five-wicket hauls of the tournament – by Starc, Neesham, and Amir, all of whom have improved on the best bowling figures.
| Players | Figures | Teams | vs | Venue | Date |
| Mohammad Amir | 5/30 | Pak | Aus | Taunton | Jun 12 |
| Jimmy Neesham | 5/31 | NZ | Afg | Taunton | Jun 8 |
| Mitchell Starc | 5/46 | Aus | WI | Trent Bridge | Jun 6 |
| Oshane Thomas | 4/27 | WI | Pak | Trent Bridge | May 31 |
| Mohammad Nabi | 4/30 | Afg | SL | Cardiff | Jun 4 |
| Nuwan Pradeep | 4/31 | SL | Afg | Cardiff | Jun 4 |
| Lockie Ferguson | 4/37 | NZ | Afg | Taunton | Jun 6 |
| Matt Henry | 4/47 | NZ | Ban | The Oval | Jun 5 |
| Yuzvendra Chahal | 4/51 | Ind | SA | Rose Bowl | Jun 5 |
Related News


Trending News